
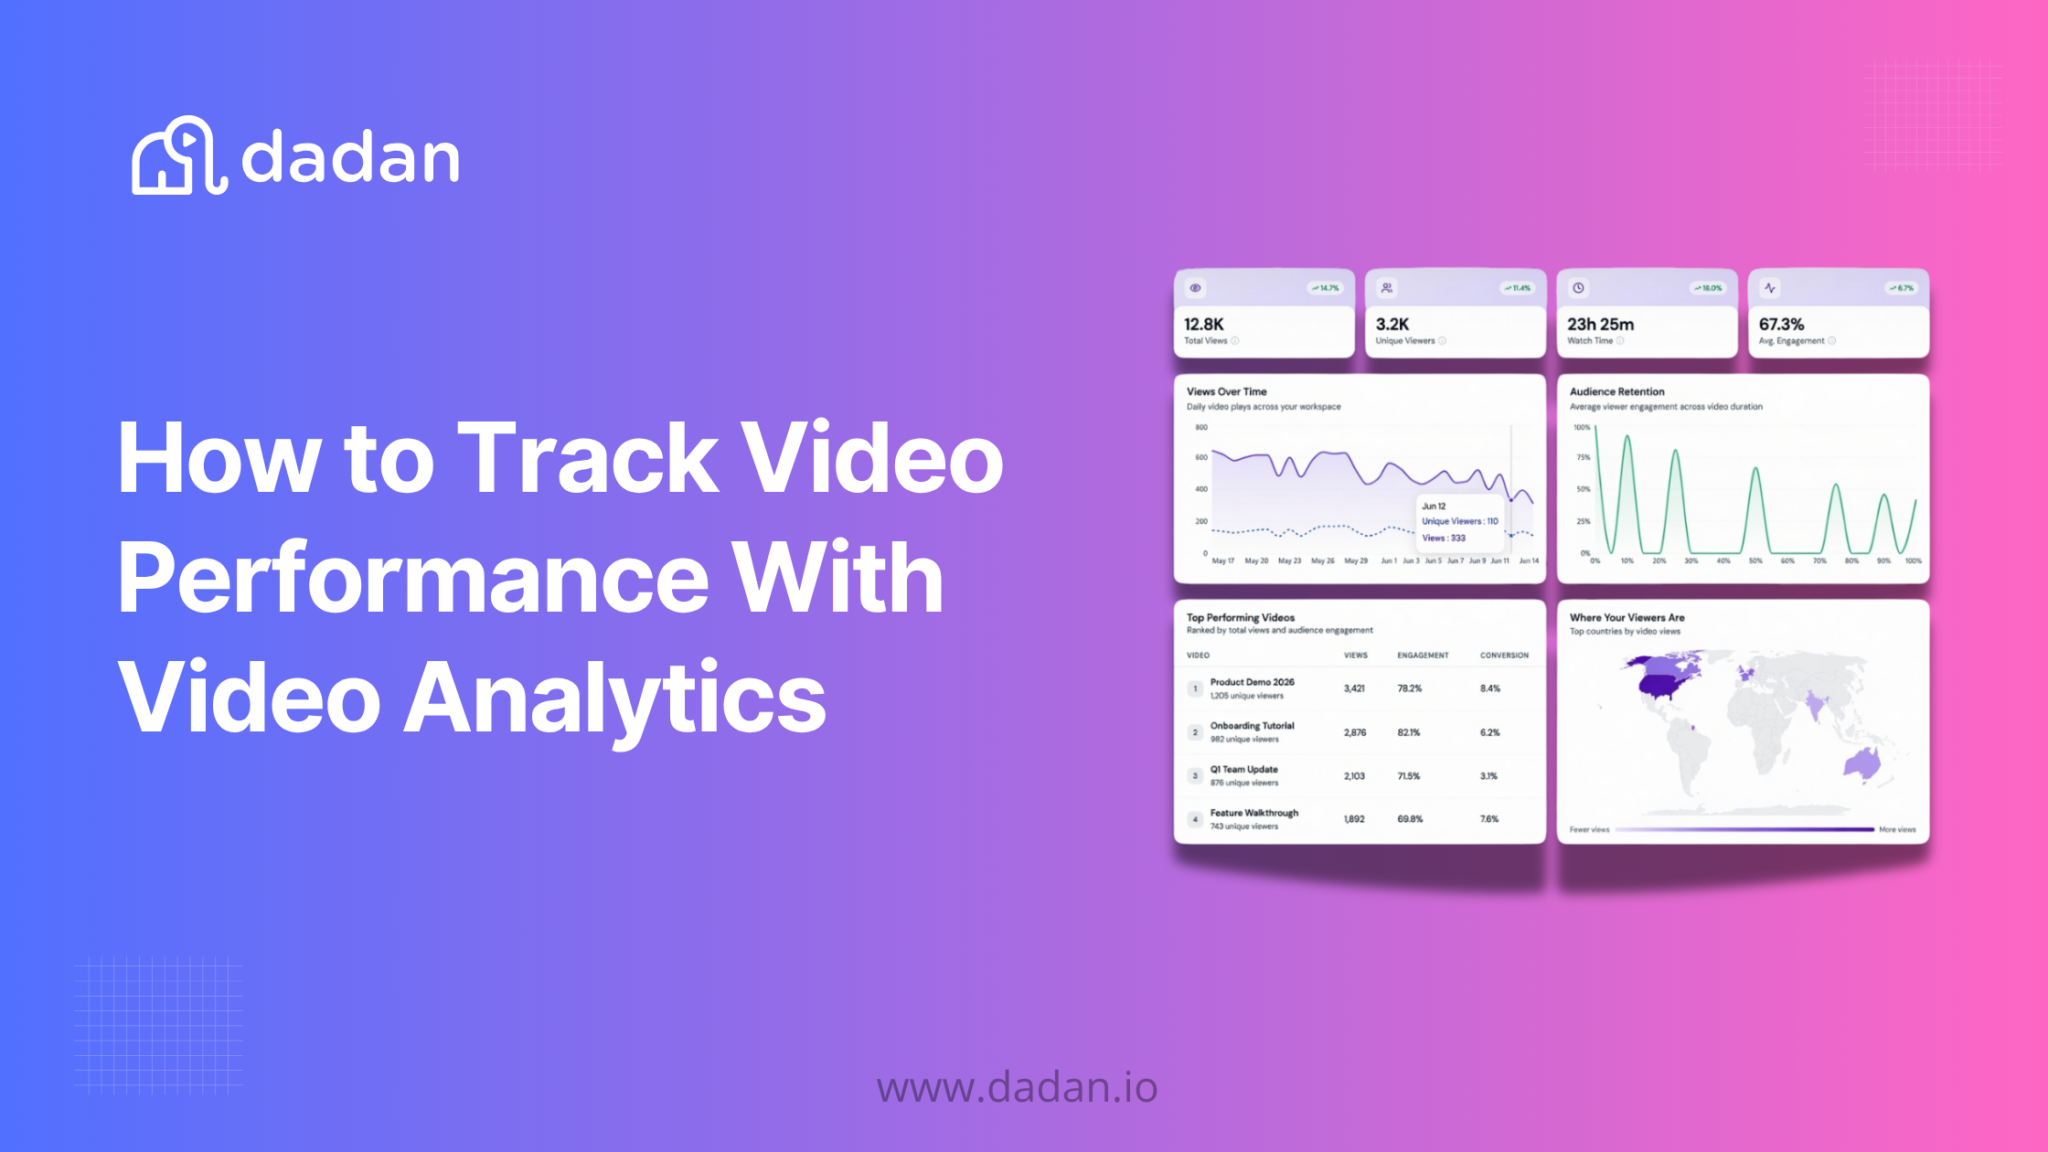
You published the video. It picked up a few hundred views, and then the trail went cold. A view count tells you a video was opened but it does not tell you whether anyone watched past the first ten seconds, where they lost interest, or whether a single person did the thing you asked them to do at the end.
How to breakdown analytics and know if a video is good or not?
by inNewTubers
Video analytics is what can make the difference.
The gap gets more expensive the more videos you make. A sales demo that loses everyone at the 90-second mark and a training clip people finish twice are both just view counts until you look at how people actually watched.
Reading that behavior, then changing what you make next because of it, is what tracking video performance really means.
TL;DR
- Video analytics is the viewer behavior data behind a video, covering how many people watched, how far they got, and what they clicked.
- Track a small set that maps to a decision, like views and view rate, average watch time, audience retention and drop-off, completion rate, and CTA clicks or conversions.
- Retention and completion tell you whether the content holds up. CTA clicks and conversions tell you whether it moves anyone to act.
- Dadan reports impressions, views, watch duration, engagement, and CTA clicks across a single video or a full workspace, plus per-viewer completion and watch times, and it updates as views come in.
What Is Video Analytics?
Video analytics is the data that shows how viewers interact with a video, from how many people pressed play to how far they watched and whether they clicked anything inside it.
There are two layers worth separating.
Reach metrics, like impressions and views, tell you how many people encountered the video. Engagement metrics, like watch time, retention, and interactions, tell you about the quality of that attention.
Reach is easy to feel good about and easy to misread. A thousand views on a video that everyone abandons after eight seconds is a worse result than two hundred views that people finish and act on.
Most modern video analytics software now leans on AI to make that second layer usable. Instead of scrubbing through recordings, you get auto transcripts, chapter breaks, and a readout of which moments held attention and which lost it.
That is the practical meaning of AI-powered video analytics for a marketing or sales team. But since the term gets used two ways. In security, “video analytics” often means computer vision applied to camera footage, like object or motion detection.
This article is about the other meaning, video content analytics for the videos you record, host, and share to an audience.
Why Tracking Video Performance Matters
Without the data, every video is a fresh guess. You reuse the intro that felt good, keep the length that felt right, and place the call to action where it seems natural. Analytics replaces all of that with evidence.
Three things that pay off the soonest and come up most often are:
- If retention drops sharply in the first fifteen seconds, the opening is the problem, not the topic. If people bail halfway through, the middle is too long or buried. You cannot see either of those from a view count, but a retention curve shows them.
- When you can see that one product walkthrough drives ten times the CTA clicks of another, you stop treating your library as interchangeable and start making more of what works.
- “The video did well” is an opinion. A video was watched to completion by forty of the sixty people we sent it to, and eleven booked a call, that’s something you can put in front of a manager. That shift is the real reason video marketing analytics is worth setting up.
Key Video Analytics Metrics You Should Track
Track the handful of metrics tied to a decision you can act on, not every number a tool can produce.
A long report you never read is worse than four numbers you check after every video. The metrics below split cleanly into two groups. The first tells you whether people are showing up. The second tells you whether the content is doing its job once they do.
This video runs through the core metrics and how to actually use them in this short breakdown.
Reach Metrics
Reach tells you how many people the video got in front of, and how many of them chose to watch.
Views and unique viewers show total plays against the number of distinct people behind them. Ten thousand views from a hundred people is a very different story from ten thousand from nine thousand, and unique viewers is what keeps you honest about actual reach.
Impressions and view rate tell you how many people saw the video available to them and how many of those actually pressed play. A low view rate usually points at the thumbnail, title, or where the video sits, not the video itself.
Engagement Metrics
Engagement tells you what people did once they pressed play, beyond sitting through it.
Interactions cover the active things people do inside a video, like answering a poll or quiz, leaving a comment, or reacting. These turn passive watching into a signal you can measure, and they matter most for training and education where you want to confirm people followed along.
Conversion Metrics
Conversion tells you whether the video moved anyone toward the action you actually wanted.
CTA clicks and conversions are the payoff. They connect watching to doing, whether that is booking a call, filling a form, or clicking through to a page. For anything sales or marketing related, this is the number that decides whether a video did its job.
Leads captured count the people who handed over contact details through an in-video form. A view stays anonymous until someone does this, so it is the point where an audience turns into a pipeline you can follow up.
Retention Metrics
Retention tells you whether people stayed, and exactly where you lost the ones who did not.
Average watch time is how long a typical viewer stays before they leave. It compresses the whole retention story into one number you can track from video to video.
Audience retention and drop-off show the shape of attention across the timeline, so you can see the exact moment people leave. This is the metric that tells you what to cut, trim, or rewrite in the next version.
Completion rate is the share of viewers who reach the end. What counts as good depends heavily on length and type, since a forty second promo and a twenty minute training module hold people to very different standards, so compare a video to others like it rather than to a universal target.
Audience Metrics
Audience tells you who is actually watching and where they are coming from.
Unique and identified viewers tell you who is behind the views, not just how many. When a viewer is signed in or arrives through a personal link, you can tie the watching behavior to a real person instead of an anonymous count.
Geographic distribution and traffic sources tell you where in the world people watch and how they reached the video. That shapes where you promote next and, for embedded videos, which pages and regions are actually driving attention.
How to Track Video Performance in Dadan
In Dadan, you open the video, open its Viewer Engagements, and read the summary and the per-viewer breakdown, then switch to the workspace view to compare videos.
Because Dadan handles recording, hosting, and sharing in one place, the analytics attach to the video you already have rather than living in a separate reporting tool. Here is the flow.
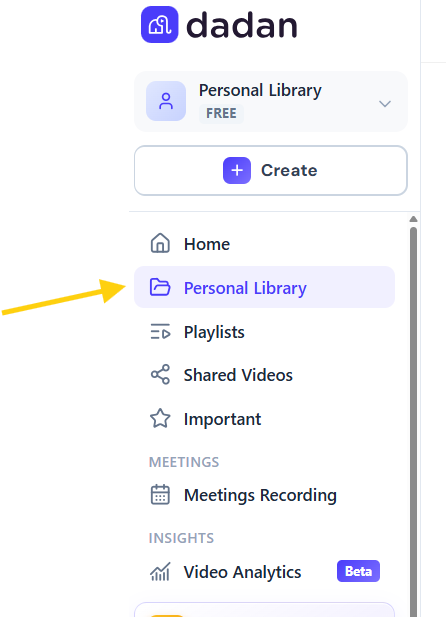
Step 1: Open The Video You Want To Analyze
Go to your library and open the specific video whose performance you want to check.
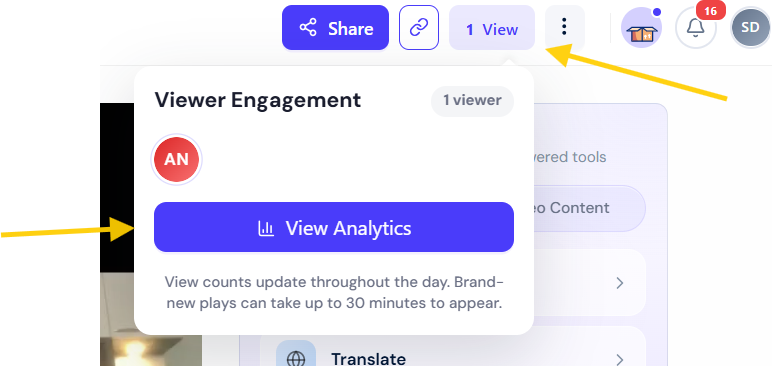
Step 2: Open Viewer Engagements And Select See Engagement
Below the video, find the Viewer Engagements panel and choose View Analytics to load the summary of how your audience interacted.
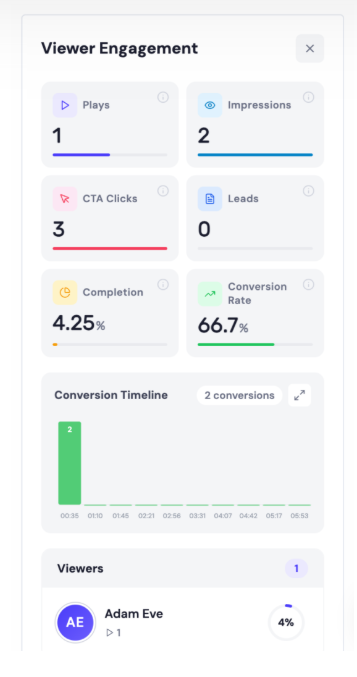
Step 3: Read The Summary Metrics
This shows total Plays, Impressions, Completion, and CTA Clicks, alongside a list of viewers. Each viewer appears by name, or as Anonymous if they were not identified.
Step 4: Click A Viewer To See Individual Behavior
Selecting a viewer’s name opens their detail, including how many times they watched, their Completion Rate for whether they finished, the specific View Times when they watched, and whether they clicked the CTA.
This is the level that tells you which individual leads are actually engaged, which is useful for sales follow up.
Step 5: Zoom Out To The Workspace View
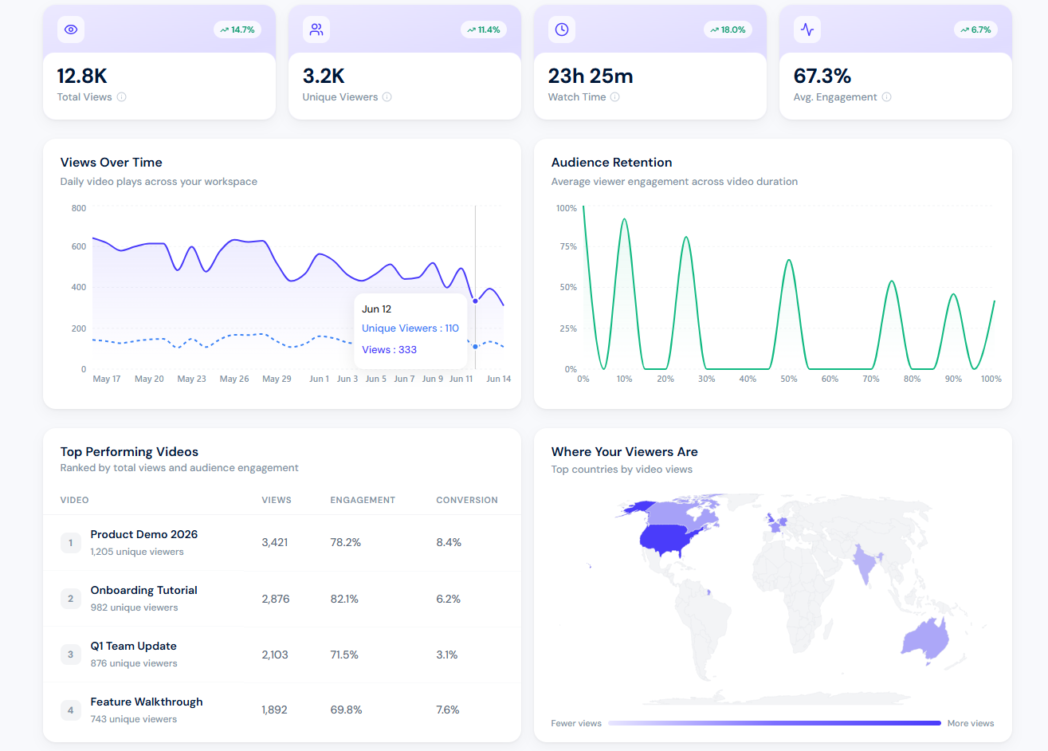
Beyond a single video, Dadan tracks impressions, views, watch duration, engagement, interaction clicks, and CTA performance across an entire workspace, so you can compare videos and spot your strongest performers rather than checking one at a time.
View notifications can be set to your own timezone, so the timestamps you read match your working hours instead of needing conversion.
And for embedded videos, Dadan reports activity by country, which tells you where your content is getting watched once it leaves your own pages.
How to Improve Video Performance Using Analytics
Read where the numbers dip, change one thing, and compare the next version so you know what the change did.
The value is in the loop. A metric only matters if it points at a specific edit.
- If your view rate is low, the problem is upstream of the video. Rework the thumbnail, sharpen the title, or move the video somewhere people actually see it, then watch whether the rate climbs.
- If retention falls off a cliff in the first ten to fifteen seconds, your opening is asking too much of people. Cut the preamble and lead with the point. Dadan’s transcript editor lets you trim that intro by deleting the text instead of scrubbing a timeline, which makes the fix quick.
- If people drop in the middle, the video is either too long or loses its thread there. Use the retention shape to find the exact segment, then trim it or reorder around it.
- If completion is high but CTA clicks are low, the content works and the ask does not. The call to action might be weak, mistimed, or easy to miss. Rewrite the copy, move it to the moment attention peaks, or make the button more prominent.
- If engagement on interactive elements is flat, add a reason to participate. A short poll or quiz placed at a natural pause gives viewers something to do and gives you a cleaner read on whether they followed the content.
The habit that separates teams who improve from teams who report is small. Change one variable, publish, and check the same metric against the last version. Over a few rounds, that is how a mediocre video library becomes a good one.
Why Use Dadan Video Analytics?
Dadan’s analytics sit in the same place you record, edit, host, and add CTAs, so the number and the fix are one click apart instead of split across three tools.
The practical benefit of that is speed. When you spot a drop-off, the editor to fix it is right there. When you see a weak CTA, you can rewrite and resize it without exporting anything. You get per-viewer completion and CTA tracking, a workspace-level view for comparing videos, geographic data at the country level for embeds, and updates that come in as people watch rather than a day later.
Mapped to the five categories above, Dadan covers four of them squarely and part of the fifth.
- Reach is covered through views, unique viewers, impressions, view rate, and country-level data for embedded videos.
- Engagement is covered through interaction and CTA clicks, plus quiz and poll responses you can export and timestamped comments and reactions on the video itself.
- Conversion is covered through CTA click tracking, conversion tracking, and in-video lead forms that pass contact details straight to your CRM.
- Retention is covered through watch duration, audience retention, drop-off, and a per-viewer completion rate that tells you whether a specific person finished.
- Audience is covered in part. You see who watched, whether they were identified or anonymous, where they watched from by country, and how each viewer behaved.
Dadan’s analytics are built around viewer engagement and conversion for the videos you host and share, which is exactly what most sales, marketing, and training teams need. If your entire goal is channel-level growth analytics for public content on a social platform, that platform’s own reporting will cover things Dadan does not try to.
For internal demos, prospecting videos, onboarding, and lead-gen content, having the analytics attached to the same video you created is the reason to keep it in one place.
Conclusion
The teams who get results from video are not the ones with the most views. They are the ones who look at what happened after the play button and change the next video because of it.
Pick four or five metrics that map to a decision, check them after everything you publish, and let the drop-off points tell you what to fix.
Start tracking your videos free at dadan.io and see how your audience actually watches.
FAQs
What metrics should I track for video performance?
Track a small set tied to decisions rather than every available number. Views and view rate tell you about reach, average watch time and audience retention tell you whether the content holds attention, and completion rate plus CTA clicks tell you whether it drives action. For most teams, those five cover the important questions.
How do I measure audience engagement?
Look past views to what people do inside the video, like how long they watch, where they drop off, and whether they answer a poll, quiz, or click a CTA. In Dadan, the Viewer Engagements panel shows views, view rate, and CTA clicks at the video level, and a per-viewer breakdown for completion and watch times.
Why is audience retention important?
Retention shows the exact points where viewers lose interest and leave, which a view count can never reveal. That makes it the most useful metric for editing, because it tells you what to cut, trim, or rewrite. A video with high views but poor retention is usually a content problem hiding behind a good headline.
How can video analytics improve conversions?
Analytics show you whether people reach your call to action and whether they act on it, so you can fix the weak link. If completion is high but clicks are low, you move or rewrite the CTA. If the video loses people before the ask, you tighten the earlier sections so more viewers ever see it.
Can I track CTA clicks in videos?
Yes. Dadan reports Total CTA Clicks at the video level and shows, per viewer, whether that person clicked the call to action. That lets you connect an individual viewer’s interest to a specific next step, which is useful for sales follow up.
Does Dadan provide video analytics?
Yes. Dadan tracks impressions, views, watch duration, engagement, interaction clicks, and CTA performance across single videos or an entire workspace, along with per-viewer completion rate and watch times. The data updates as views come in.
Which videos benefit most from video analytics?
Any video with a goal beyond being seen benefits, but the payoff is highest for sales demos, prospecting videos, product walkthroughs, onboarding, training, and lead-gen content. For those, knowing who watched, how far, and whether they acted directly shapes your follow up and your next video.